Monday, September 29, 2014

Bash History Forensics

Bash History Forensics

I recently had the privilege to do a decent amount of forensics on a bunch of Linux systems. I've been a Linux hobbyist since Ubuntu 8.04 but I would never have described myself as a power user.  While I still have a lot to learn, here are a couple hints that helped me get through many, many lines of recorded user command history.

Before we get started, let me just point out where the .bash_history files are located:
You can find the "root" user's file at "/root/.bash_history" and the history file a <user> at "/home/<user>/.bash_history".  Be sure to check for all users' .bash_history files.

Techniques

Things to check first

Before you jump right in and start trying to figure out what in the world a user was doing on a system, you should be aware of any pre-configured aliases that the user could be using as a shortcut.

The article by "crismblog"  at http://community.linuxmint.com/tutorial/view/891 describes how you (or a bad guy) can create a bash alias with a simple command such as alias install="sudo apt-get install", and adding a line like that to a configuration file can save that alias for future use. Be sure to check the following common configuration files for  aliases and keep in mind their may be other files in use:
  • /root/ or /home/<user>/
    • .bashrc 
    • .profile
    • .alias
    • .alias-csh
      • Hint: Keep an eye out for other installed shells and their configs such as "C Shell". They usually also keep history files that can be analyzed in a similar fashion to bash history.
  • /etc/
    • bash.bashrc
    • profile

De-duplication and Sorting

After I get a read-only image mounted and ready to go and check for aliases, I usually extract/copy the bash history files for each user onto my analysis drive and save a second copy as with a CSV file extension. This allows me to double click it and open it right into excel for de-duplication and sorting.  The advantage of de-duplication and sorting allows me to quickly look through all the recorded commands while not wasting time on duplicate entries.  It is also convenient to see how many unique IPs were used with SSH, which files were edited with vim/nano/etc., and so on. 


To remove duplicates and sort with Excel, highlight everything with a Ctrl+A, click on "Data" up at the top, and click on "Remove Duplicates". You can then click one of the sort buttons to group similar commands.

I usually end up color coding commands I think are good/bad/suspicious by changing the cell's fill color. This allows me to skip some commands and keep track of what I have to come back to by using Excel's "Filter by color" feature.  With this technique, I can easily see commands that weren't analyzed yet, all bad commands, or even color coded typos pretty quickly.

But wait, what about the context?

The de-duplication and sorting provides a quick, high level overview of the commands recorded, but you lose the important context that is timing.  For most bash history files, the only explicit time context you can get is from the .bash_history file's last modified timestamp and the order the command appeared in.  You may be able to derive some other timing information based on the coordination of logs or file metadata with related commands.  

By looking at bash history in it's raw existence (in Excel or a good text editor), you can see the order in which files were executed. By looking at sorted history, we may have seen the user  used a compression command such as rar, zip, or tar and they used an scp command with a remote IP address. Looking at the raw history may tell you these commands were executed adjacent to each other which can put some puzzle pieces together.

Timestamps? Sounds good!

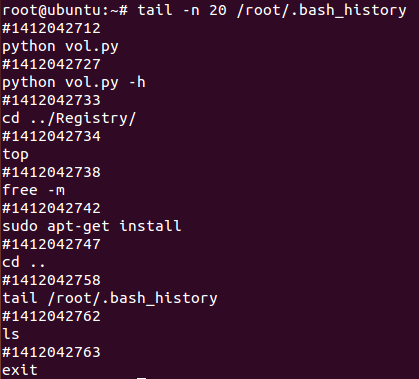
If you get lucky, the bash history may be recording the Epoch timestamp of every command.  I've only come across this twice in the field, but it was pretty great. The post over at http://larsmichelsen.com/open-source/bash-timestamp-in-bash-history/ explains how bash history timestamp recording can be enabled with a command such as export HISTTIMEFORMAT="%F %T " >> /etc/bash.bashrc  and how timestamps can be displayed with the history command.

If you are lucky enough to have timestamp recording enabled, you should note that it will mess up your de-duplication and sorting efforts as it will add a lot of entries that look like #13342793 that won't provide much information when they are separated from their respective commands. 


You can convert these timestamps with http://www.epochconverter.com/ or you can even use their suggested Excel formula =(A1 / 86400) + 25569 if you are an Excel ninja.  Please note that these timestamps are recorded in UTC/GMT. 

Tool Time

To provide some more context around executed commands, it is useful to know the working directory at the time of execution.  The best way to do this is to follow the cd commands executed before the suspect command. For a busy busy user, this can be difficult to track down. To combat this problem, I created a script that you can git from https://github.com/davidpany/BashHistoryCDFinder.  The screenshot below shows how easy it is to see a specified number of cd commands executed before one or more commands that start with a string of your input: 


In this example, you can see exactly what directory I executed this ssh command from by following my directory changing trail.  The more cd commands you choose to look at, the more context you may get.

What's the catch?

So yes, bash history logs are awesome and can provide tons of evidence, but there are a couple things to look out for. First, it is possible to configure bash to discard commands by linking the .bash_history file to /dev/null or different file for hiding. If the history files look sparse, also check the configuration setting listed above for any mention of /dev/null or a configuration of the HISTFILE variable to a non standard file.

Also, bash history is usually only appended to the history files on a clean exit from terminal. A clean exit can be a logout, an exit command, a reboot, or even a GUI terminal close. Here are a few reasons bash history may not be written to disk:
  • loss of system power
  • OS/terminal crash
  • SSH connection ended without a proper logoff
  • application or terminal forced to stop with Ctrl+Z
If the user has the proper permissions, they can also just delete the .bash_history file or overwrite it with another file, although you may see the  command they used to do that.

It is also worth noting that commands may be saved to the history file out of chronological order. This may be caused by multiple sessions open on system concurrently that are closed out of order. While there is no good way to detect this without timestamp logging, it is important to keep in mind.

Hopefully this post will help give you a starting point for dealing with huge .bash_history files and maybe some good ideas you might not have considered. Please share your tips with me on Twitter @DavidPany or in the comments here.

Thanks for reading! 

-Dave


Monday, April 28, 2014

Never Accidentally Pwn Yourself Again!

"Sell Me This Pen"

In case you haven't seen The Wolf of Wall Street yet, I'm about to tell you why you need to keep reading.

Do you ever download a bunch of suspicious files from your favorite blacklist? Do you ever have to analyze suspected phishing e-mails a C-level executive received? Do you ever export a bunch of executables from an image that do not have MD5 matches on VirusTotal?

Best practice for DIY malware analysis is typically to copy the file/s into a network isolated virtual machine and go to town with static and dynamic analysis. Every once and a while though, we accidentally double click that EXE file that may or may not contain a backdoor. After all, how much time do you need to wait before a terrifying double click turns into the second click that allows you to rename the file's extension to ".mal"? What happens if you sneeze after a right click and your mouse accidentally jumps all the way up to  Open and clicks that instead of Rename?


Accidents do happen. Realistically though, you probably just have a bunch of files and don't want to take the time to rename each one.

You Don't Need a Pen, You Need a Script

No matter what the problem was, I wanted a quicker, safer way to rename my suspicious files. I also wanted to write a little batch script because I had never written one before. Execution Protector.bat was born!

Execution Protector.bat adds an underscore character ( _ ) to the extension of every file in the current directory.  It simply loops through every file in the current directory and adds the underscore if the the file name in question does not match the batch file's name. You can download the script at https://github.com/davidpany/ExecutionProtector.

The easiest way to run this script in a Windows environment is to copy it to your malware repository and double click the file in Windows Explorer.


A black cmd.exe window will open and close quickly, and once Explorer refreshes, your files' extensions will have changed!


Now your files are safe from the dreaded accidental double click. 

If you don't want several copies of the script hanging around in each case's malware directory, you can simply cd to the malware directory and just run the script from wherever it may be.


How Does This Keep Me Safe?

The Windows Registry keeps track of which program opens which file type by its extension. I don't know of any extensions ending in an underscore that Windows will natively execute. Since Windows willnot automatically execute the file with intended application, the malware will not be successful.

Would You Buy A Free Pen?

Could you just zip up all the suspicious files instead? Yes.
Are there other similar tools out there? Probably.
Can the script's code be written with one line? Most Likely.
Was The Wolf of Wall Street a great movie that is in no way family friendly? Absolutely.

So not everyone may need this script, but I enjoyed writing it and this post. I plan on making bash, python, and powershell versions in the future just for fun. Thanks to the various Stack Overflow posts I referenced for parts of the script. Please let me know in the comments or @DavidPany if you have any questions or suggestions.

Thanks for reading!

-Dave

Sunday, March 30, 2014

When Seconds Matter, Accurate Chrome History is Only Minutes Away

Chrome Funrensics

With Google Chrome's surge of popularity since its inception, even the bad guys are using it. There are several great free tools out there that make Chrome history analysis pretty simple. There was one main issue though with the most comprehensive tool I was able to find, and I'll let you know how to get around it.

This post is intended to be beginner friendly and is built on the SANS blog post http://digital-forensics.sans.org/blog/2010/01/21/google-chrome-forensics/.

Locating Chrome Artifacts

According to the SANS post above, the Chrome History file is an SQLite database that can be found in the following locations:


  • Vista and 7
    •  C:\Users\[USERNAME]\AppData\Local\Google\Chrome\
  • XP
    • C:\Documents and Settings\[USERNAME]\Local Settings\Application Data\Google\Chrome\
I was able to then find the History file in the User Data\Default\ directory inside the Chrome directory.

Let's open up this directory on our Windows 7 test system with FTK Imager. You can see there are a bunch of evidence files, but we're going to focus on the file simply named History.


After exporting this file to an evidence directory, we'll get started with the tools.

NirSoft Chrome History View

First up, NirSoft has two great tools out there that do very specific tasks. This is a blessing and a curse as each tool is very comprehensive for its purpose, but some valuable information gets missed such as downloads and autofill data.

Chrome History View does a great job of doing just what its name implies. It will provide a detailed list of  of each website saved in the History file including the URL, Title, Timestamp, Visit Count, how many times the user manually typed the URL, Referrer if available, and a Visit ID.

Selecting Options > Advanced Options, we can have the tool open up the extracted History file instead of the running system's Chrome history.


All the fields mentioned above are then shown for all visited websites.


From this view, the data is easily selected with your favorite selection techniques including Ctrl + A, Shift + Click, and Ctrl + Click. You can then Ctrl + C or right click to copy and paste the data right into Excel for powerful manipulation.

NirSoft Chrome History View can be downloaded from http://www.nirsoft.net/utils/chrome_history_view.html for free.

NirSoft also offers a tool called Browser History View that can be downloaded from  http://www.nirsoft.net/utils/browsing_history_view.html. This tool is capable of grabbing history from FireFox, Chrome, IE, and more all at once from a running system, just a user on the running system, or an evidence folder containing the evidence files.

NirSoft Chrome Cache View

NirSoft's other Chrome specific tool is able to parse Chrome's cache of webpage objects saved from the user's browsing activity.

The Chrome cache can be found in the following location inside the Chrome folder:

  • Chrome\User Data\Default\Cache

This directory should contain several files named data_0, data_1, and so on; many files named f_000001, f_000002, and so on; and a file named index. Looking at the objects in this directory with a forensic tool will allow you to see the file signatures and contents. Quick analysis shows the f_ files are the webpage objects while the data_ and index files contain metadata apparently for the f_ files.


Firing up Chrome Cache View, it's important to remember the tool also allows you to choose an exported evidence cache directory with the same advanced options menu as Chrome Browser View.


Chrome Cache View will parse the metadata for each f_ file and provide information such as File Name, URL, Content Type, Size of the File, Last Accessed, Server Time, Server Last Modified Timestamp, Expiration Time, Server Name, the Server's HTTP Response, Detected Encoding, the related f_ file name, and more cache related data.

Basically, the tool parses the metadata and tells you which f_ file was downloaded when and from where. With this information, it is possible to locate that f_ file for further investigation with your forensics tool or copy the files out using the Copy Selected Cache Files To... option shown below for manual analysis.


Sometimes analysis of the cache can show files downloaded or browsing content not found in the History file.

Chrome Cache View can be downloaded from http://www.nirsoft.net/utils/chrome_cache_view.html for free.

Browsing history and cache files are great and all, but there's definitely more information we want to find!

Woanware ChromeForensics 

Woanware's ChromeForensics tool provides even more great Chrome data.

After a quick installation, you can load the chrome history files from your evidence directory. This tool appears to parse multiple, if not all files, from the User Data directory, so load that directory or an exported copy of it.


This tool will provide information for Web Page Visits similar to Chrome History View, Search Terms used with Google.com, Downloaded Files, Autofill Entries, Cookies, Favicons, Thumbnails, and a History Index.


You can see now that even more information is provided by this tool. History of downloaded files can be especially useful in an investigation.

This tool is not quite perfect though. One minor annoyance is a clunky GUI when manipulating column positions. A bigger problem for me concerns the timestamps provided not including a seconds field. There must be some way to get the seconds field at least, right?

ChromeForensics can be downloaded at http://www.woanware.co.uk/forensics/chromeforensics.html for free.

When Seconds Count

We know information about seconds are available from the NirSoft tools, so why doesn't ChromeForensics provide these details? I'm not sure, but taking a suggestion from the SANS post and remembering how the History file is just an SQLite database, we can just use an SQLite database browser GUI such as the one found at http://sourceforge.net/projects/sqlitebrowser/ for free.

Opening the History file with this Database Browser displays the structure which is also described by SANS.


By changing to the Browse Data Tab, we can choose the database table we'd like to check out. Let's look at that useful downloads table.


We can see the start time and finish time shown in this table.

Now things get weird.

While examining a Windows Server 2003 system with an older version of chrome, this timestamp was formatted as Unix Epoch. It could be decoded simply at http://www.epochconverter.com/. That site also contains formulas for converting these timestamps in various programming languages and a super useful excel formula.

On my test system running Windows 7, the timestamp provided isn't so straightforward. I'm not sure what the differences are in how the timestamps are generated, but I think I know how to decode them.

The first step of converting the timestamps is to get the data out of the SQLite Browser. Unfortunately this tool does not support intuitive copy and paste. You must double click the timestamp and copy it out from the edit window one... at... a... time...


So this isn't the most efficient way to get the data, but it works. It gets even weirder though, to convert this timestamp, you have to copy the value into http://www.silisoftware.com/tools/date.php, add a 0 onto the end of the number (effectively multiplying it by 10), choose the filetime option, and click convert.


The correct timestamp, down to the second, is then shown in the Text Date row.

Wrapping Up

I hope you enjoyed reading this mix of tutorial and personal findings. I know using the different Chrome tools, the SQLite Browser, and the sometimes strange time conversion process isn't beautiful, but it can be done!

The good news though is that a Chrome forensics python script is on my to do list that will hopefully provide easy reporting of the important information and may even dig into other Chrome artifacts such as the Preferences file.

Thanks for reading!

-Dave

Wednesday, February 5, 2014

SMTP Testing With smtp-sink and PyEmailTest

SMTP Testing

This is a nice little tutorial meant for people who may be new to the world of email messaging, or those who need a way to set up a test environment for email.

This blog post will cover:
  • Creating an smtp-sink to receive emails and confirm connections
  • Manually sending emails to a Message Transfer Agent (MTA) using telnet
  • Using PyEmailTest.py to test email flow to an smtp-sink, MTAs, or email security technologies

Why?

Personally, I needed a way to quickly diagnose whether or not security products were successfully sending email notifications to their email server. Rather than configure my own full blown email server, I discovered that Postfix has a handy little built in tool called smtp-sink. This tool’s sole purpose in life is to act like a vacuum and suck up any emails thrown at it. By default, smtp-sink discards all received emails, but we are going to save these emails to verify their content. The choice is up to you though.

Note: Please visit http://www.postfix.org/smtp-sink.1.html for smtp-sink’s full capabilities. Configurations such as sending bounce messages (non-delivery reports), variable MTA settings, and more are available for your experimentation.

My Environment

For this project, I used the following environment:

Machine
Purpose
IP address
Ubuntu Virtual Machine
smtp-sink
192.168.254.167
Virtual Security Appliance
Send SMTP notifications
192.168.254.149
Mint Virtual Machine
Manual Email Testing
192.168.254.169

Note: I used VMware Workstation for my environment. You can use the free VMware Player or the VirtualBox for your environment. To make sure the Virtual Machines could communicate with each other, I placed all of their network adapters on the same VMnet which essentially connects them to a hub on the same subnet. Please leave a comment if you need assistance setting this up. I also used DHCP to automatically configure the IP addresses. To view ip addresses a Linux machine, use the command ifconfig.


Installing smtp-sink On Ubuntu

smtp-sink is a tool included with the standard installation of Postfix. To install Postfix on a standard version of Ubuntu, use the command sudo apt-get install postfix.  This will automatically install Postfix on your machine from Ubuntu’s repositories.


Since you are DOing this command as Super-User (sudo), Ubuntu will prompt for your admin password. Ubuntu may also ask you to confirm your decision to use disk space.


Read the different configuration types if you desire. We are going to choose “Local only” in the next step. I haven’t worked with the other configurations so let’s avoid them for now.

Use the left and right arrow keys to highlight <Ok> and press Enter to accept.


Use the left, right, up, and down arrow keys to choose “Local only” and then press Enter on <Ok>.


For our purposes, we are not concerned with how emails are handled by domain since we are dropping them. You can leave the default here or change it if you wish.


The installation process should finish as shown above. Now we are ready to turn on the smtp-sink to receive emails.

Running smtp-sink

The only information you need to know to run smtp-sink is your machine’s IP address and your working directory since that is where you will be saving the emails to. Use the ifconfig command from before to find your IP address and use the sequence below to make a new directory for this testing:


Now that we know my ip address is 192.168.254.167 and we are working out of our new EmailTest directory, let’s start smtp-sink with the following command, filling in your information for the <variables>.

               sudo smtp-sink –u <YourUserName> -d –c <YourIPAddress>:25 100

               Example command that I ran:
sudo smtp-sink –u dave –d –c 192.168.254.167:25 100

sudo
“Super-User Do” allows us to run this command with admin or root privileges
smtp-sink
This is the program we are running, it was installed automatically when we installed postfix
-u <YourUserName>
Since we are running with sudo, smtp-sink needs to know which user’s privileges to use. Use the username that appears at the beginning of the command line prompt
-d
Signals that we would like to dump each message to a new file in the current directory. If we do not use this option, all received emails are discarded.
-c
Makes a counter that iterates when an email is received. This does not appear to work when the –d option is used, but it is required to run.
<YourIPAddress>:25
*Make sure to use the IP address of your machine running smtp-sink!*
IP address of the port we are using to receive emails on and port number. The IP should be that of your eth0 interface found in ifconfig and the default port for SMTP is tcp 25, so we will use that.
100
The command requires a number be entered here as a backlog which is defined as “The maximum length the queue of pending connections, as  defined by the listen(2) system call.” This is not important to us so let’s just keep it at 100.


After running this command, the terminal will just sit there and listen. We need to let this run and not interrupt it. You may open another terminal or tab if you would like to run other commands.

In another terminal window, running the command nautilus /home/dave/EmailTest opens Ubuntu’s GUI file browser. We can now watch this as we send emails to smtp-sink.


Note: Other versions of Linux may use other GUI file browsers than Nautilus. It may be best to find the icon on your desktop.

Sending Emails To smtp-sink From My Virtual Security Appliance

I realize you may not have a virtual security appliance or email sending application (not yet anyway) but I feel compelled to describe my first validation of smtp-sink.

I logged into my appliance and configured the following settings for sending email notifications:

Recipient Address
RecipientAddress@TestDomain.com
Sender Address
SenderAddress@TestDomain.com
SMTP Server
192.168.254.167
SMTP Server Port
25

Sure enough, when I sent a test message, it showed up in the EmailTest directory on Ubuntu.


Sending Emails via Telnet

But Dave, I don’t have a virtual security appliance capable of sending test emails!

I realize not everyone has access to hardware or software (not yet anyway!) that can readily send emails on demand to try out this smtp-sink. Have no fear! Next we are going to use Telnet to manually send emails to the smtp-sink.

I found out not too long ago that you can use Telnet to connect directly to the MTA that is being run on an email server. In our scenario, postfix is our MTA and since we are using smtp-sink, our MTA will receive the emails and pretend it is going to forward them to their true destination.

We are going to telnet from our Mint VM to the smtp-sink which is listening on Ubuntu’s port 25. You can also use your host machine for this telnet session. If you are using Windows, you will need a telnet client such as PuTTY.

Note: You must telnet to the IP address of your Ubuntu machine running smtp-sink


The simple command telnet <YourMTAIPAddress> 25 will open a connection from Mint to smtp-sink. The “220” indicates a successful connection. You can find out how to decipher MTA Response Codes at http://email.about.com/cs/standards/a/smtp_error_code.htm.

By using SMTP Commands such as the ones described at http://www.yuki-onna.co.uk/email/smtp.html we can send this message to smtp-sink.


If you follow the script above, you should see another message appear in Ubuntu’s EmailTest Directory!


Note: I have not read how to decipher the file names, so I keep track of which files are newest by arranging them by modification date by “right click” > “Arrange Items” > “By Modification Date” as shown below. This puts new messages at the end.


Let’s open up this email file and see what we can find.


Just as you may have expected, all the information from the Telnet session made it into the message. Notice how even though you can spoof (fake) the sender’s address, you cannot adjust the Client Address that originally sent the email. This header information is how forensic analysts can track down spoofed emails.

Sending More Test Emails

Wow, we just sent a customized email!  Okay, that may not be exciting enough to warrant an exclamation point, but I thought it was neat the first time I saw it work.

Keep in mind, the true goal of testing these emails is to make sure connections are open to real email servers and those servers are then routing messages properly. Telnet-ing to a server is great for testing a connection and sending simple emails, but what if you wanted to test the capacity of an email server, or make sure it was forwarding or even analyzing/filtering attachments properly? It sounds like we need a tool for this.

I have heard of people using deprecated versions of Outlook Express and Java based tools to manually send emails to a specific Email Server IP. After trying to find a secure version of Outlook Express and not wanting to use Java due to cumbersome version installs and security risks, I decided I wanted my own tool to send emails my way. Special thanks though to Finn Ramsland, a co-worker of mine who wrote an email script for a different purpose. I borrowed a couple lines of code from that script. Thanks, Finn!

Note: Cloning existing tools is a great way to sharpen your scripting skills while being able to customize your own features. Use caution with copyrighted or patented software though. I’m no legal expert so talk to an expert if necessary.

I now present to you, for lack of a better name: PyEmailTester. I created this command line based tool to send customizable emails to any SMTP MTA that can be reached without authentication. At the time of this writing, this tool needs to be run on either a Windows machine or a Linux machine with python’s Tkinter package installed. Tkinter is used for the file selection pop up box to choose which file to attach.

To install Tkinter on Linux, use the command sudo apt-get install python-tk

  
When using this tool, the following items are configurable:
  • Sender Address
  • Recipient Address
  • Subject
  • Message Body
  • Server Address
  • Port Number to connect to
  • Attachment – You can add one attachment 
  • Number of times to continuously send this email – for capacity tests

Use Cases for this tool:
  • Testing connectivity and basic mail flow
  • Testing server capacity
  • Submitting malicious emails to a mail filter or content analyzer


Tool Demo

Before we start using this tool, let’s delete the older emails so we don’t get confused.


There we go, fresh and clean again.

To get started with PyEmailTest, you can find it on my GitHub at https://github.com/davidpany/PyEmailTest. If know how to pull repositories with git, that works. If you have no idea what git or GitHub is, just download a zip of the script from https://github.com/davidpany/PyEmailTest/archive/master.zip.

After downloading and unzipping the file on a different VM (I’m using Mint but you can use any other OS as long as python and Tkinter are properly installed), we can see the script is ready for action.


To run this script on Linux, open a Terminal, change your working directory to where you extracted the .py script, and run the command python PyEmailTest.py


As shown above, the script will ask if you want to use the default values for Sender, Recipient, Subject, Message Body, and Port.  If you choose to not use the Default message settings, you can customize each of these fields.

You must always enter in the Server address you want to send to. For us, this will be the IP address smtp-sink is listening on.

Then you can choose to add an attachment. If you type “yes”, a Tkinter popup will appear. For now, let’s just attach the script itself. Choose the PyEmailTest.py script and click on “Open”

The tool will then ask how many times you would like to send this message. I have entered 3. This will resend the same message with the same attachment 3 continuous times. 


Sure enough, back on the smtp-sink Ubuntu machine, 3 emails were received and stored in the EmailTest directory.


Looking at the Emails

Opening one of these email files in our text editor shows the default settings defined by the script as well as the sending client’s IP of 192.168.254.169 or whatever IP your sending machine was set to. Information regarding the Subject, Body, and Attachment are also given such as MIME Version, Encoding type, and Content-Disposition. For the filename, the whole path of upload directory is shown. I’m not sure if this is true for emails sent with traditional email clients or not, but it is scary in this situation.


So where did the attached python script go? Well it turns out that SMTP email was never designed to send files. It was created only send to send plaintext ASCII. To send special fonts, pictures, and attachments; objects are encoded to a format that consists only of readable ASCII characters. Shown for the attachment above, its encoding type is base64. This means that long block of random characters contains our file. All we need to do is copy that entire block to the website www.base64decode.org and let it do the work.

Note: Be sure to copy to the end of the character block as indicated below. It is also common to see one or two equal signs (=) at the end of a base64 string as padding. Include them as well!


Now we can see the readable beginning of the python code that allowed us to send the message!

Websites such as http://www.motobit.com/util/base64-decoder-encoder.asp even have the option to write the output to binary file so don’t have to worry about copy and pasting errors when trying to save a non ASCII file.

Wrap Up

I hope you enjoyed this little tutorial. If you are new to this, I hope it was easy to follow. If you are a ninja, thank you for reading and I hope you may have found something useful here.

You should have learned how to:
  • Create an smtp-sink to receive emails and confirm connections
  • Manually send emails to a Message Transfer Agent (MTA) using telnet
  • Use PyEmailTest.py to test email flow to an smtp-sink, MTAs, or email security technologies
Thanks for reading!

-Dave